
Going Up – Why the Construction Pipeline Means Higher Metrorail Ridership (Part One)
We’ve claimed that Transit-Oriented Development (TOD) projects in this region will be critical to Metrorail ridership and sustainability. The good news is that our assertions are grounded in statistically rigorous evaluations of TOD’s impact on Metrorail ridership – here’s how. (Part one of a two-part series).
While factors like fares, service, and the economy can certainly explain some changes in Metrorail ridership, one absolutely fundamental explanation of differences in walk ridership between stations is development. Why does a station like Landover see only 50 riders arrive on foot each morning, and a station like Crystal City see over 3,000? Why does a station like Bethesda see balanced ridership in all directions, where a station like Suitland is almost entirely one-direction? Development. Even a simple scatter plot shows that households alone near the station explain 70% of AM Peak walk ridership!
Planning studies have long-posited that transit-oriented development is such a key part of driving ridership, and if that is the case, then TOD is vitally important to Metro’s long-term financial sustainability. We at Metro needed to quantify this link in a more sophisticated and system-specific way, and so we created a way to calculate the impact of land use changes (household growth, employment growth, new development) on ridership and revenue.
What is a Land Use-Ridership Model? To help, Metro’s Planning Office has built a Land Use-Ridership Model that will predict changes in Metrorail ridership as a result of occupancy changes (growth, decline, new development, etc.) in the station area. This model helps us get very specific when it comes to modeling the impact of land use changes on ridership and revenue. It helps us answer questions such as: “When developers build a new apartment building next to a Metrorail station how much ridership and revenue will Metro realize?”, and; “If an office building is proposed at one of four Metrorail stations, which location maximizes ridership and revenue without exacerbating core capacity constraints?”

This tool is based on a rigorous understanding of the link between land use and the rail ridership we see today and is built on “direct ridership modeling techniques” found in academia. It also focuses specifically on “walk ridership” (which constitutes 38% and 78% of our AM and PM peak ridership), since rides related to bus transfers, parking, and other access modes are less related to adjacent land uses.
To build this, we analyzed the actual quantity of walkable land uses from each station area, assembled detailed information about land uses and densities in those areas (households, jobs by industry type), and also controlled for other, non-land-use factors that shape ridership – like network accessibility. In all we worked through over 200 independent variables in our modeling and also brought in experts from the University of Maryland’s Center for Smart Growth, professors Hiroyuki Iseki, Ph.D. and Chao Liu, Ph.D., to bring their analytical and statistical firepower to the fray.
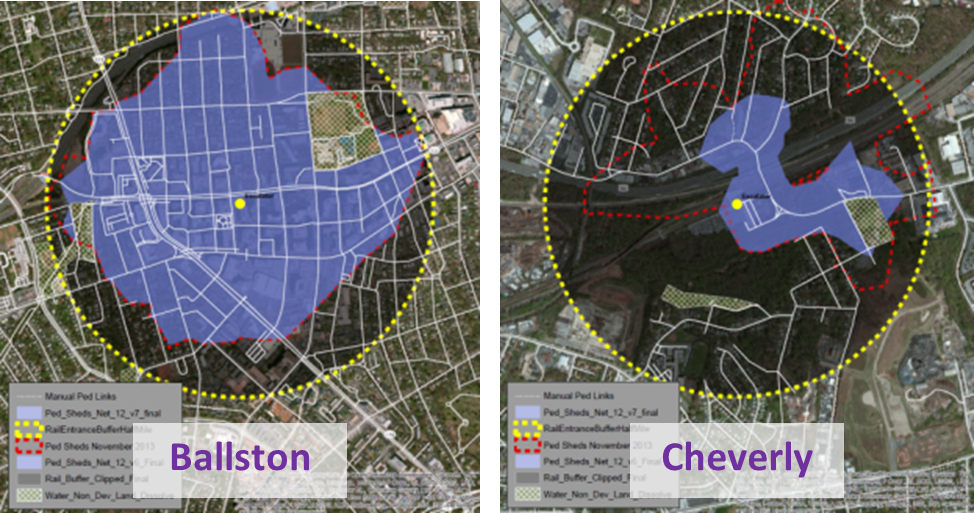
How We Built It. We defined the walkable area as a half-mile walk along a road network, so we account for barriers like highways and fences. The half-mile cutoff is a bit longer than the median actual walk distance reported by our riders in the 2012 Metrorail Passenger Survey. For each station and its walk shed, we tested the following kinds of factors:
- Number of households, and number of jobs, by industry type (NAICS code)
- Demographics like median income
- Built environment variables like block density, WalkScore, land use diversity
- Accessibility to jobs and households scores via Metrorail from that station
- Metrorail service characteristics like trains per hour, transit connectivity index
- Relative competitiveness of Metrorail vs. driving
Finally, we used these in multivariate regressions to predict walk ridership, and the resulting coefficients are applied in the model to make forecasts.
Results: What Influences Ridership? We settled on a series of regression models by time period, since trip purposes can vary significantly by time of day.
- For both peak periods, we learned that accessibility — how much “stuff” can you get to by taking Metrorail — is a huge component of understanding ridership. Access to jobs from a station increases its morning ridership, and conversely access to households from a station increases a station’s PM Peak ridership. It also holds in off-peak times.
- In the morning, another major factor is households. The more people who can walk from home to the Metro station, the more ridership – that effect is very statistically significant. Other factors also explain AM Peak ridership – jobs access and congestion on the roads.
- During the midday, universities and schools are strongly linked to midday ridership – especially at stations like Foggy Bottom, Tenleytown, Brookland-CUA, and others. Retail, restaurants, and bars also help explain midday ridership, and we also see a persistent but small effect from the population in the neighborhood.
- In the PM Peak, the other major factor is jobs in addition to access to households.
- Evening ridership is determined by three main factors – schools, retail/restaurants/bars, and the number of jobs in the area. The effect on retail/restaurants/bars is quite large here.
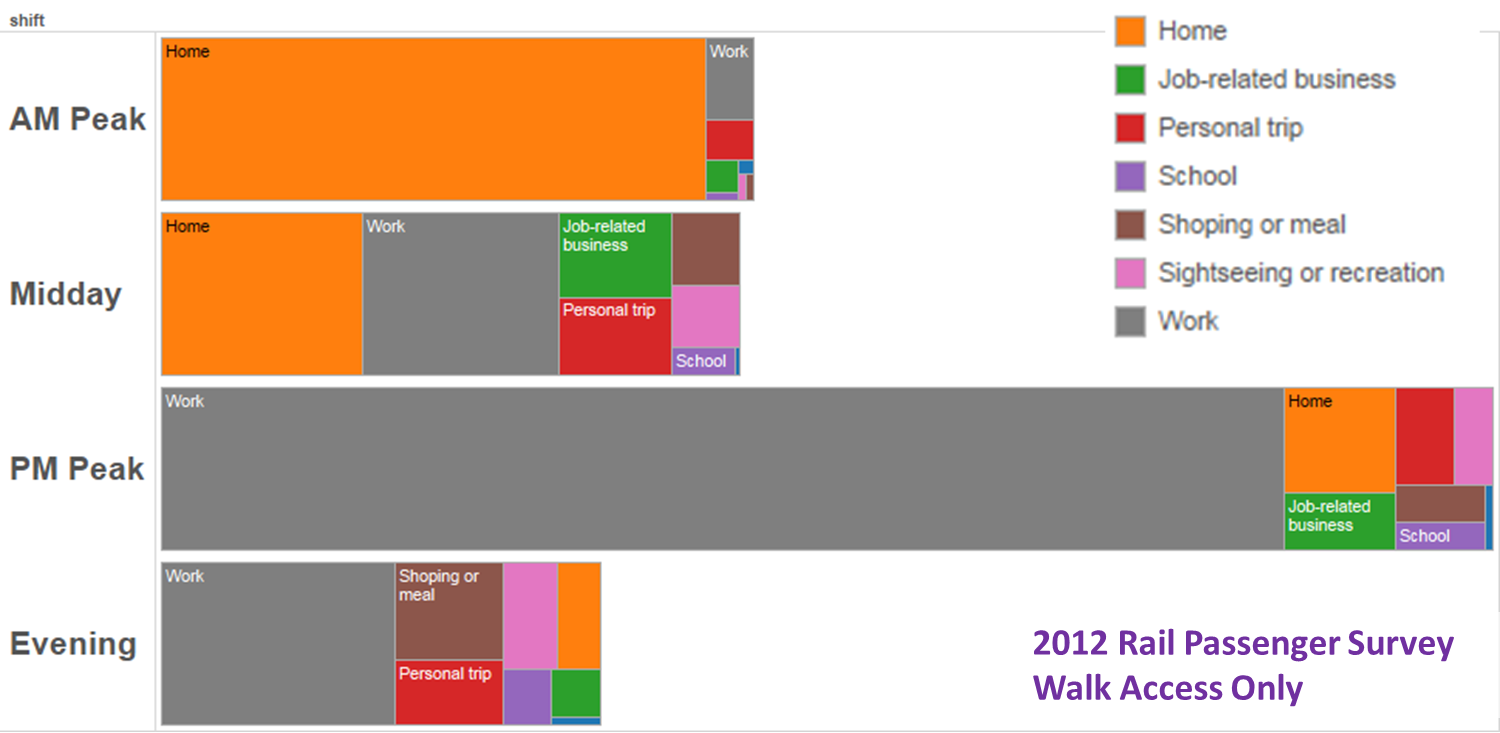
“Where did you come from just before entering the Metro station?”
So when we apply this model, we control for a variety of factors that explain ridership differently at different stations. And importantly, the results are station-specific. For example, we generally know that the number of jobs at a station determines PM Peak entries. But we also know that rate is higher for stations with higher access to households, so the model yields a higher forecast for a station with good household access.
What Can We Use This For? Using this model, we can answer questions such as:
- If developers build an office building at Station X or Station Y, which generates more ridership?
- Given the planned development at any station, will the added ridership necessitate more station capacity, like a additional escalators or a second entrance?
- What kinds of development produce ridership at off-peak times?
- How much density would be required to generate $X of fare revenue?
- How much additional revenue could we achieve by fixing pedestrian barriers?
What’s Next? In the coming months we will continue to refine and improve this tool, and we plan to soon test it using data on big development projects currently under construction or planned for Metrorail stations as well as use it to inform our understanding of how near-term development may warrant capital investments to keep up with ridership. And of course we will use this model to augment our existing macroeconomic forecasts of system-wide ridership trends.
Deeper documentation of the model here (.pdf).
Next, we’ll use this model to understand the ridership that Metrorail can and should anticipate absorbing in the near-term, based on the most recent report outlining the pipeline of development projects either under construction or planned for near-term delivery . We’ll preview that analysis with you in the next post. Stay tuned…

Have you applied this model to the Purple Line? If so, how do the ridership predictions compare to those Maryland used in its FTA funding grant applications? If not, how much time and effort would it take?
I have long thought that MTA’s Purple Line ridership forecasts underestimate the ridership that can be expected from the University of Maryland, Bethesda, and Silver Spring — not to mention Langley Park — because those models are so much more trip purpose and employment based than development pattern based…
I have read that WMATA is planning development at several of its stations and has requested bids from interested parties. Is it possible to find out the status of these development proposals? As someone who lives near one of the Metro stations under consideration for development (Forest Glen), I would like to know what the plans are and when they might be implemented.
@jnb
No, we have not yet tested this model on Purple Line stations. Since it’s based on Metrorail data, it might be a bit of a leap to apply it to light rail? Hard to tell. To do this, you’d need to construct walk sheds for the stations, overlay the jobs and population data described in the PDF, and then build accessibility scores using station-to-station travel times.
@abc
For info on specific developments, check out our Real Estate page.
@abc
It looks like our Real Estate page is a little outdated (refresh coming by end of June). Until then, the best way to get more information about specific projects is to email our Real Estate team directly – realestate@wmata.com. Thanks for reading!