Archive for April, 2015

The K9 MetroExtra Bus Route Surpassing Expectations

April 30th, 2015 8 comments

Two years and 500,000 riders later, the K9 continues to demonstrates the benefits of MetroExtra limited-stop bus service.

At the end of this month, the K9 bus route will pass an important milestone – it will carry its half-millionth rider.  Since its inaugural run, the K9 has continually surpassed all of our expectations.

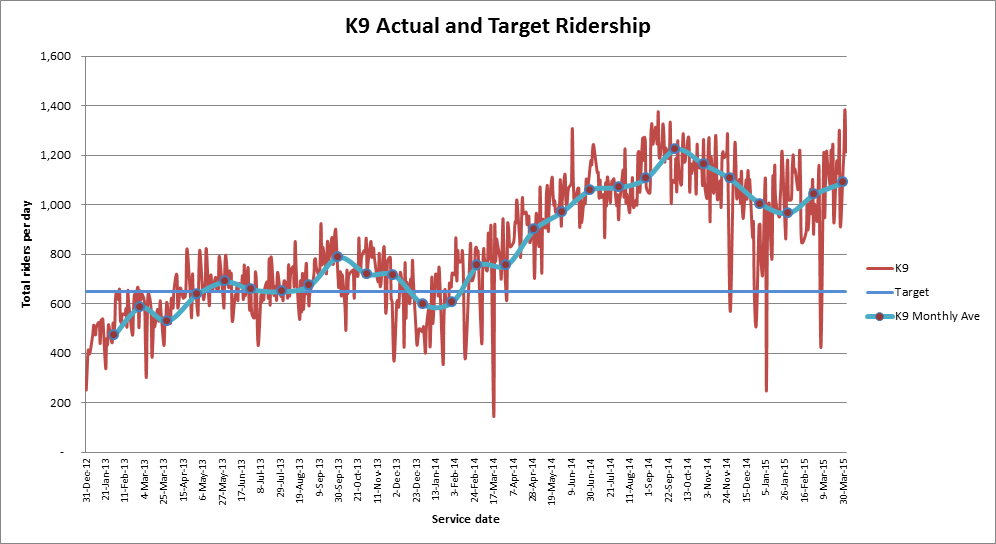
The concept for the K9 emerged from a year long study on bus service needs in the New Hampshire corridor and on New Year’s Eve 2012, Metro launched the K9 service – the first limited-stop bus service introduced in Maryland in many years. The K9 provided faster and more reliable service along New Hampshire Avenue between Fort Totten Metrorail station and the Northwest Park apartments in Montgomery County. Riders responded enthusiastically, pushing the K9 over its 6-month target of 650 daily riders in less than four months.  In March 2014, we extended the route north to the Federal Research Center in White Oak to coincide with the transfer of several thousand FDA employees to that facility and increased the service frequency to every 15 minutes.  Ridership surged again, passing 1,000 daily riders for first time only a week later. Two months later daily ridership was up another 20% to 1,200 daily riders.

K9 Ridership by day

Ridership on the K9 has grown an astonishing 50% year-over year for the past two years in a row, and this growth has not come at the expense of ridership on the underlying K6 local bus service (the K6 grew 2% between 2013 and 2014 and has been virtually flat for 2015).  Instead, the K9 has tapped into pent-up demand for transit service within the corridor by providing desperately needed capacity.  Read more…

Do You Bike to Metro in Fairfax County? Your input is needed!

April 28th, 2015 Comments off

Fairfax County seeks input from bike-and-ride commuters.

Bike FairfaxAs we have discussed previously, safe and convenient pedestrian and bicycle access is critical to Metro’s success, and WMATA works closely with local jurisdictions to find ways to improve conditions for customers arriving on foot or bike. Compared with the high expense of building more parking garages for park-and-ride customers, investing in better walking and biking infrastructure is an incredibly cost-effective way of attracting Metro customers. On Metro station property, WMATA is making investments such as bike parking and path improvements.  On the public streets beyond, our local and state partners are installing their own new facilities for people walking/biking to the station. Read more…

Vast Majority of New Office in Region Near Metro

April 22nd, 2015 2 comments

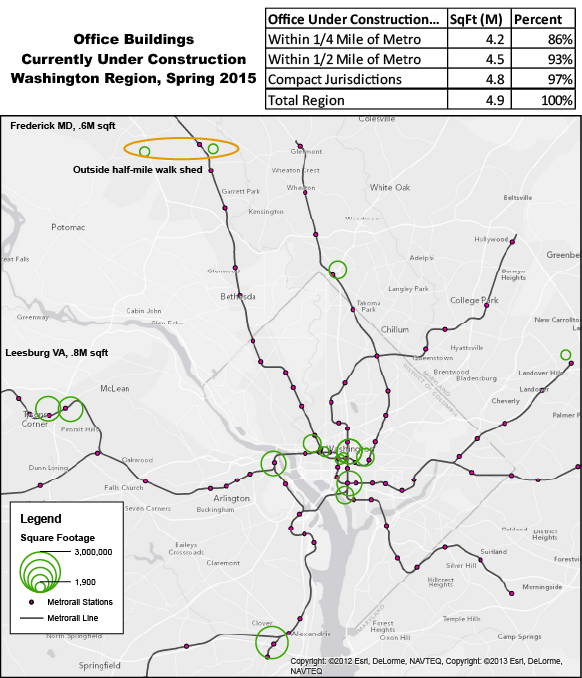
Approximately 86% of the region’s new office construction is occurring within one-quarter mile of Metrorail stations, 93% within the half-mile walk sheds.

A Washington Post article from October 2013 made a staggering assertion:  That 84% of new office construction in the region is occurring within one quarter mile of a Metrorail station, according to Jones Lang LaSalle and other data sources.  As we continue to dig into walk sheds and the land-use/transportation connection, we thought we would revisit this assertion and update it for 2015.

Since the Post article was written, we have begun to plan for near-term capacity constraints that might result from increased ridership caused by new households and jobs near Metro.  And part of this planning is gaining insight as to where and when new housing units and office space may come online through real estate industry data sources.   Through this research, we are able to update the statistic above:

86% of new office construction in the Washington region is occurring within one-quarter mile of a Metrorail station. 

UnderConstructionMap-01

New office currently under construction in the Washington region. All but four projects are within a half-mile of Metrorail.  Data from Jones, Lang, LaSalle.

Read more…

Metrorail: A Long-Term Solution

April 20th, 2015 12 comments

Metrorail has had a huge impact on the region, but as we’ve seen with the Silver Line, it can take decades to get from concept to execution.

One of the questions I hear most often as a planner for Metro is When will a Metro station open in xyz neighborhood, “in Georgetown”, or “at BWI”? It was the first question at the March Citizens Association of Georgetown meeting. My response — “Decades” — often elicits audible groans.

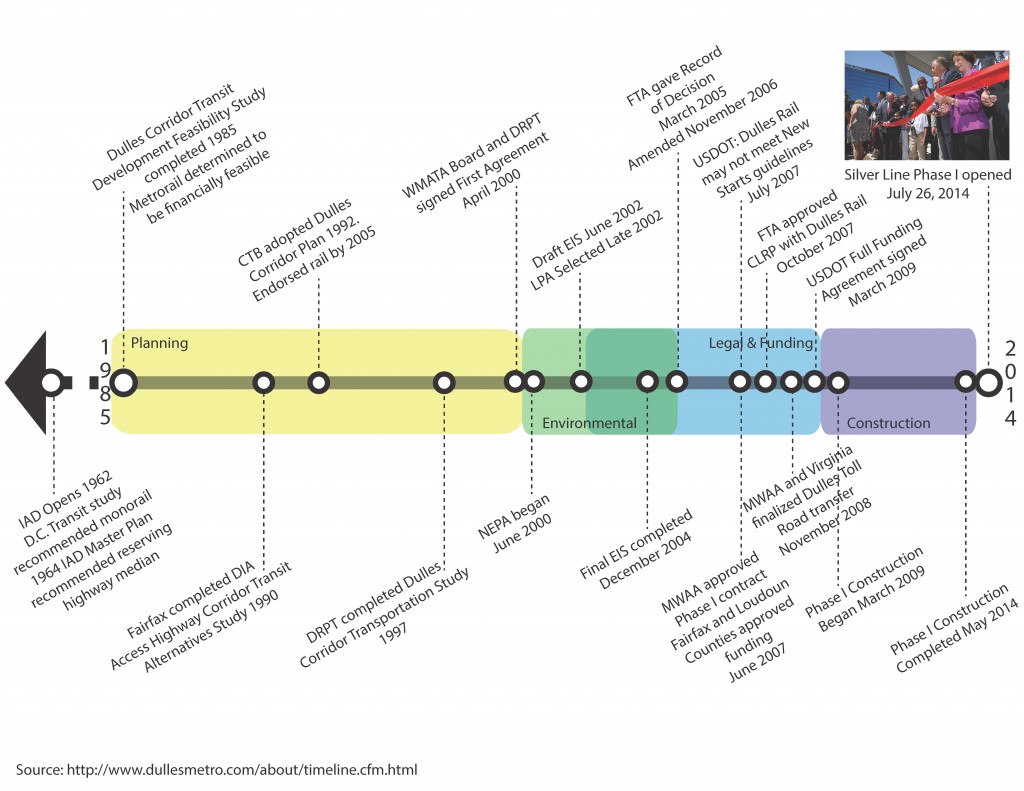
Given last summer’s opening of the Silver Line, we have a case study that can provide insight on how long it takes to plan, fund, and construct large infrastructure projects. The Dulles Corridor Metrorail Project has done a phenomenal job of maintaining a project timeline. Since the region has many recent newcomers, it is helpful to revisit many of the key milestones, as shown below. It is also helpful to remind readers that the Metropolitan Washington Airports Authority (MWAA) was the ultimate developer of the Silver Line (both Phases I and II) and that the project “only” required cooperation among the Commonwealth of Virginia, MWAA, Metro, the federal government, and Fairfax and Loudoun Counties. While just one example, the Silver Line’s long story is not vastly different from other mega-projects happening in the region and across the country.

Timeline for Planning, Environmental Process, Legal and Financing, and Constructing the Silver Line

Read more…

Metrorail Revenue by Station – Visualized!

April 15th, 2015 6 comments

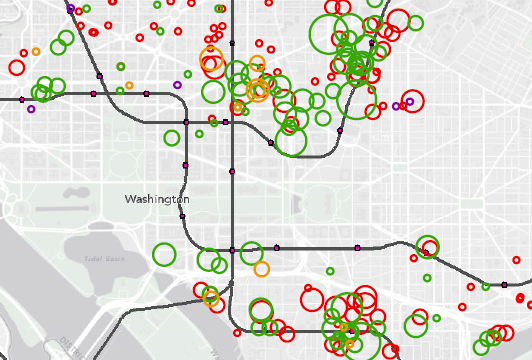
Where and when does Metrorail generate the most farebox revenue? So far the data reinforces the notion that ours is a truly regional system with strong revenue contributions from all jurisdictions – but of course, the story is far more complicated than that…

What kind of rail system is Metrorail? Urban subway? Commuter rail? Hybrid? The answer of course is all of the above. And if that is the case, what kind of ridership and revenue patterns should its stations and system exhibit? High levels of peak revenues with heavy commuter lot usage but relative inactivity during the day? Lower levels of peak period activity but a steady stream of usage throughout the day? Depending on your perspective (and travel patterns) one might argue for either, and it might seem easy to apply a blanket classification to Metrorail and declare that “only urban stations cover their cost” or “commuter stations contribute largely to Metrorail’s revenue picture.”

Well, when you throw the data up on a map, it becomes clear that there are no easy answers, and no one right way to view the revenue picture of our tri-jurisdictional hybrid rail network. Some conclusions from the data are intuitive, some less so. Among them:

  • Differences in ridership across stations are bigger than differences in revenue, so ridership is a stronger explanation of differences in revenue than fares. For example, Shady Grove’s average fare in the AM Peak is $5, which is twice as much as the smallest average fare. On the other hand, ridership at Shady Grove is ten times higher than other stations, so the ridership better explains the station’s revenue.
  • In the AM Peak, the terminal stations dominate in terms of revenue contribution. Union Station functions as an internal “terminal station,” meaning that the commuter rail and Amtrak connections to Metro are extremely important to the overall ridership and revenue picture.
  • Other stations with strong bus or commuter park-and-ride infrastructures also pop in the AM Peak, such as Silver Spring and Grosvenor.
  • Note how well the non-Silver line stations in Virginia perform in the AM Peak, as well as the somewhat expected better performance of the Shady Grove branch of the Red Line in the AM Peak.
  • In the PM Peak, the core is king. Stations like Farragut West and North, Metro Center, L’Enfant Plaza are producing $50,000 apiece every evening thanks to their job densities, reinforcing the importance of improving their capacity for the future in Metro 2025, as well as their huge importance to revenue today. By comparison, in the AM Peak, only Shady Grove and Vienna approach these levels of revenue at roughly $40,000 per station.
  • The New Carrollton and Largo Town Center branches of the Blue/Orange/Silver Lines contribute significantly less revenue than other branches, and this directly relates to the relative lack of transit-oriented development along these spines.  The station areas on these lines enjoy a superb level of rail connectivity to the region’s primary job cores, but without sound transit-oriented investments to-date, they have not yielded the type of ridership and revenue commensurate with the capital investment. Imagine what Metro’s revenues (and farebox recovery) could look like if these segments were properly developed!

We’ve been examining the data ourselves as we continue forward with Momentum’s call for us to ensure financial stability for the Authority and have created the visualization for you to play with. We’d love to know what you see!

Monitoring (and Caring About) Customers, Not Just Trips

April 13th, 2015 2 comments

Deep explorations into the composition of Metrorail’s customer base shows that Metro has a wide reach – and that the five-day-a-week rider may not be as common as you think.

Metro (bus and rail) moves 1.1 million people per day, right? Well, technically we see that many trips (transactions) per day, but how many individual customers is that?  When you look at your fellow passengers on-board a train, how many are frequent commuters? How many rarely ride? In addition to counting trips, we’ve begun to monitor customers – the number of unique SmarTrip cards and paper tickets used on the system in a month.

We’re starting with Metrorail at first.

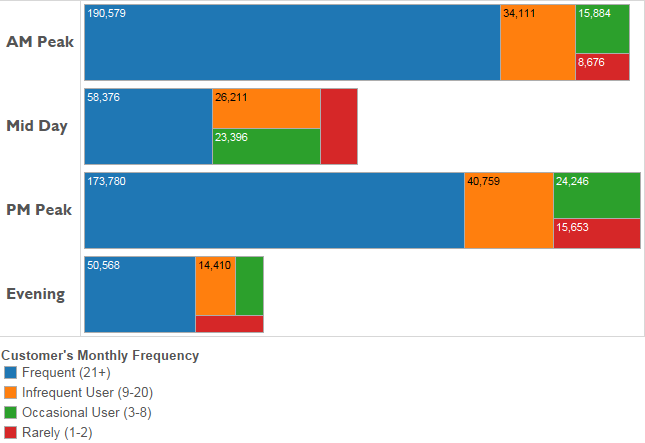
Metrorail typically handles roughly 730,000 trips on a weekday, which are generated by about 400,000 unique customers. Some of those customers ride frequently, and others will ride only once in the month.  As the chart below shows, of the 730,000 trips, only about two-thirds are generated by frequent customers.  Not surprisingly, frequent customers dominate more during the peak times.

Sept 2014 ridership by frequency by period_bars

Typical weekday rail ridership (trips) by customer’s monthly frequency (trips/month)

Surprisingly, over 17% of all trips are generated by customers who take eight trips/month or fewer– that’s fewer than once per week.  That may not seem like much, but in order for infrequent customers to generate so much of our ridership each and every day, there must be a LOT of them! Read more…

Going Up – Why the Construction Pipeline Means Higher Metrorail Ridership (Part Two)

April 7th, 2015 6 comments

In Part Two of this series, we forecast the impact of the region’s near-term development pipeline on Metrorail ridership, using the Land Use-Ridership model. The good news? Metrorail ridership is set to show big gains. The bad news? Your ride just got less roomy.

Just as we were putting the finishing touches on this post, we saw a flurry of news articles detailing the regional market forces that portend increased rail ridership. Millennials choosing not to drive, even as they grow up.  Office parks in far-flung places experiencing devaluations while Metrorail-adjacent areas capturing the lion’s share of new leases.  Marriott announcing that it will seek a transit-accessible location when it moves.  And even defense contractors coming to bat to argue for the economic benefits of the Purple Line. All of this free publicity set us up nicely for what we wanted to share with you – the first results of the Office of Planning’s Land Use-Ridership model as applied to near-term development projects.

The Near-Term Pipeline. Researchers at Jones Lang LaSalle have been compiling a list of actual development projects – under construction, or planned – near Metrorail stations, so that we can forecast the near-term capital needs for the system. A huge amount of development (over 105 million square feet!) is on the books for within a half-mile of a Metrorail station.

NearTermPipeline_Thumbnail

Map of near-term development projects near Metrorail, by building type (click for full image)

So, How Much Ridership? What impact will all of this have on Metrorail? We ran these projects through the Land Use-Ridership model, and what we found was both intuitive – and startling. Read more…

Going Up – Why the Construction Pipeline Means Higher Metrorail Ridership (Part One)

April 6th, 2015 5 comments

We’ve claimed that Transit-Oriented Development (TOD) projects in this region will be critical to Metrorail ridership and sustainability. The good news is that our assertions are grounded in statistically rigorous evaluations of TOD’s impact on Metrorail ridership – here’s how. (Part one of a two-part series).

While factors like fares, service, and the economy can certainly explain some changes in Metrorail ridership, one absolutely fundamental explanation of differences in walk ridership between stations is development.  Why does a station like Landover see only 50 riders arrive on foot each morning, and a station like Crystal City see over 3,000?  Why does a station like Bethesda see balanced ridership in all directions, where a station like Suitland is almost entirely one-direction? Development. Even a simple scatter plot shows that households alone near the station explain 70% of AM Peak walk ridership!

Planning studies have long-posited that transit-oriented development is such a key part of driving ridership, and if that is the case, then TOD is vitally important to Metro’s long-term financial sustainability.  We at Metro needed to quantify this link in a more sophisticated and system-specific way, and so we created a way to calculate the impact of land use changes (household growth, employment growth, new development) on ridership and revenue.

What is a Land Use-Ridership Model? To help, Metro’s Planning Office has built a Land Use-Ridership Model that will predict changes in Metrorail ridership as a result of occupancy changes (growth, decline, new development, etc.) in the station area.  This model helps us get very specific when it comes to modeling the impact of land use changes on ridership and revenue.  It helps us answer questions such as: “When developers build a new apartment building next to a Metrorail station how much ridership and revenue will Metro realize?”, and; “If an office building is proposed at one of four Metrorail stations, which location maximizes ridership and revenue without exacerbating core capacity constraints?”

LURM general flow

This tool is based on a rigorous understanding of the link between land use and the rail ridership we see today and is built on “direct ridership modeling techniques” found in academia.  It also focuses specifically on “walk ridership” (which constitutes 38% and 78% of our AM and PM peak ridership), since rides related to bus transfers, parking, and other access modes are less related to adjacent land uses.

To build this, we analyzed the actual quantity of walkable land uses from each station area, assembled detailed information about land uses and densities in those areas (households, jobs by industry type), and also controlled for other, non-land-use factors that shape ridership – like network accessibility. In all we worked through over 200 independent variables in our modeling and also brought in experts from the University of Maryland’s Center for Smart Growth, professors Hiroyuki Iseki, Ph.D. and Chao Liu, Ph.D., to bring their analytical and statistical firepower to the fray.

How We Built It. We defined the walkable area as a half-mile walk along a road network, so we account for barriers like highways and fences.  The half-mile cutoff is a bit longer than the median actual walk distance reported by our riders in the 2012 Metrorail Passenger Survey. For each station and its walk shed, we tested the following kinds of factors: Read more…

Please Give Us Feedback on Next Year’s Budget

April 2nd, 2015 9 comments

We’re not raising fares or cutting service in next year’s budget, but we are still proposing some changes – and we’d love to hear from you.

Take SurveyTo balance Metro’s budget for the coming year, the District of Columbia, Maryland and Virginia governments have pledged to increase their funding for Metro, while Metro continues to take actions to cut costs and operate more efficiently. We are still considering the following options that may impact you:

  • Increase the daily parking fee at Minnesota Ave. station to the same price as all other Metro parking facilities in the District ($4.60).
  • Extend the hours we collect parking fees at Metrorail stations by one hour in both the morning and evening on weekdays.
  • Eliminate the TransitLink Card (TLC) pass – one of the few remaining paper farecard products in the Metrorail system.

We need to hear from you – tell us how these proposals would affect you:

  • TAKE AN ONLINE SURVEYComplete the survey to provide your feedback before 9:00 a.m. on Monday, April 13.
  • ATTEND THE PUBLIC HEARING on Tuesday, April 7 at 6:30 p.m. (Information session at 6:00 p.m.).  Register to speak by emailing speak@wmata.com.

Metro Headquarters (Jackson Graham Building) 600 5th St NW, Washington DC 20001

Take Metrorail: Gallery Place or Judiciary Sq

Take Metrobus: 70, 74, 79, 80, D6,  P6,  X2, X9

The public hearing location is wheelchair accessible. For accommodations for people with disabilities, call (202) 962-2511. For language assistance, such as an interpreter or information in another language, please call 202-962-2582 at least 48 hours prior to the public hearing date.

 Public comments will be considered by the WMATA Board of Directors when adopting the final Fiscal Year 2016 budget plan.