Archive for August, 2014

Data Download: May 2013-2014 Metrorail Ridership by Origin and Destination

August 28th, 2014 22 comments

DataDownloadFuzzyMay 2013 and 2014 Metrorail ridership data is available: what patterns do you see?

Following up on our last data download of rail ridership from May 2012, 2013 and 2014 are now available. These data now represent three “snapshots” in time of rail ridership, at a very fine level of detail.  This data can help answer questions, such as: where is ridership growth the strongest? Which destinations are becoming more or less popular?  How has off-peak vs. peak ridership changed? 

May 2013 Metrorail Ridership by Origin, Destination, TimePeriod, DayOfWeek (.xlsx, 3.3 MB)

May 2014 Metrorail Ridership by Origin, Destination, TimePeriod, DayOfWeek (.xlsx, 3.4 MB)

We invite you to tell us what you see, in the comments.

Technical notes on the data are the same as the last post.  This time, Saturdays and Sundays are shown in the same worksheet as weekdays.

Where are the Late Night Metrobus Riders?

August 27th, 2014 1 comment

The majority of late night bus boardings are in DC, focused along the 14th/16th Streets NW corridor.

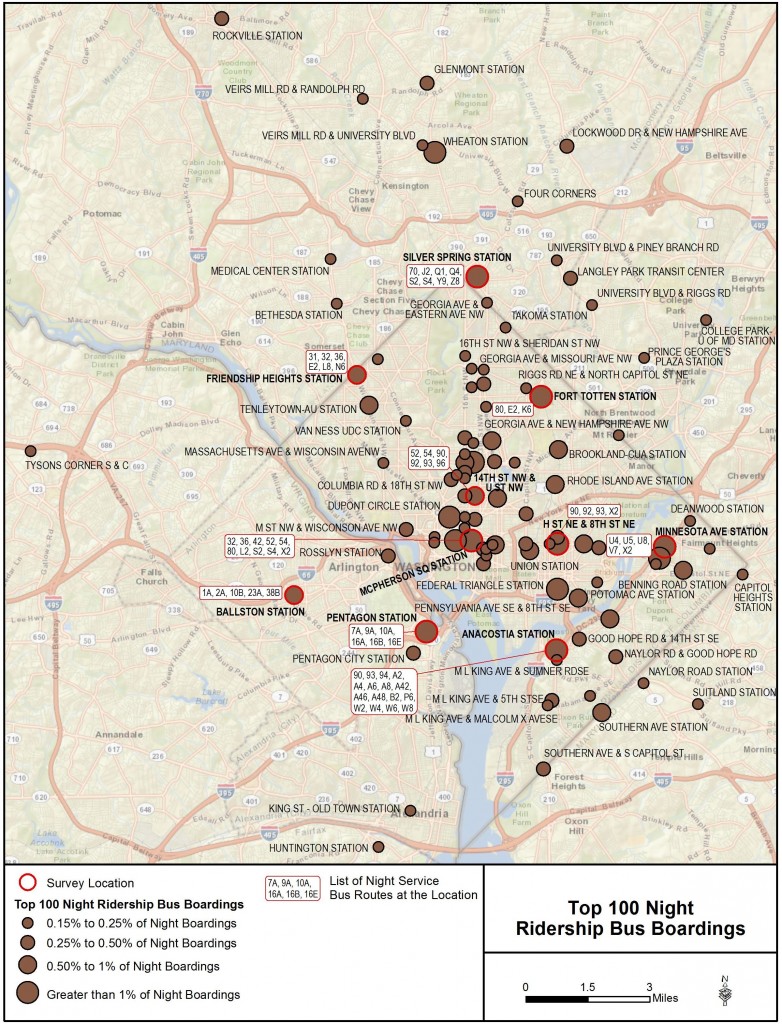
As we’ve mentioned before, Metro is conducting a study examining late night bus service in the region.  An initial step was to assess where the late night boardings are happening in order to determine which might be the best locations to focus in-person survey efforts.  Below is a map showing the locations of the top 100 locations where riders board Metrobus from 11pm-4am each night.  Rather than reflecting the total ridership of a stop, the magnitude of the circles on the map reflect that location’s share of overall late night bus ridership.

Top 100 Late Night Metrobus Boarding Locations

Top 100 Late Night Metrobus Boarding Locations*

Some notes on the map:

  • Almost all of the major bus boarding locations (those with more than 1% of the total) are at Metrorail Stations, even though Metrorail stops operating just one hour into the late night period on weeknights.
  • Not surprisingly, most of the boardings are in DC, many of which are concentrated in the 16th/14th St NW corridor from downtown to Columbia Heights.
  • The data only reflect Metrobus boardings, so if boardings on local operators such as DC Circulator are added, the total numbers of late night bus boardings would be higher than what is shown here.
  • Of course this only tells us where the riders are boarding, not necessarily where they’re going; we are investigating that as part of the study.

What do you see that stands out?

* Note that Southern Avenue Metro Station replaced 14th & U Street as an in-person rider survey location.

Categories: Metrobus Studies Tags: , ,

Bordeaux: City of Wine and… (No) Wires?

August 25th, 2014 2 comments

Known to most Americans for its famous wine varieties, Bordeaux is also an innovator in surface transit technologies that allow for wireless tram operations on its downtown streets.

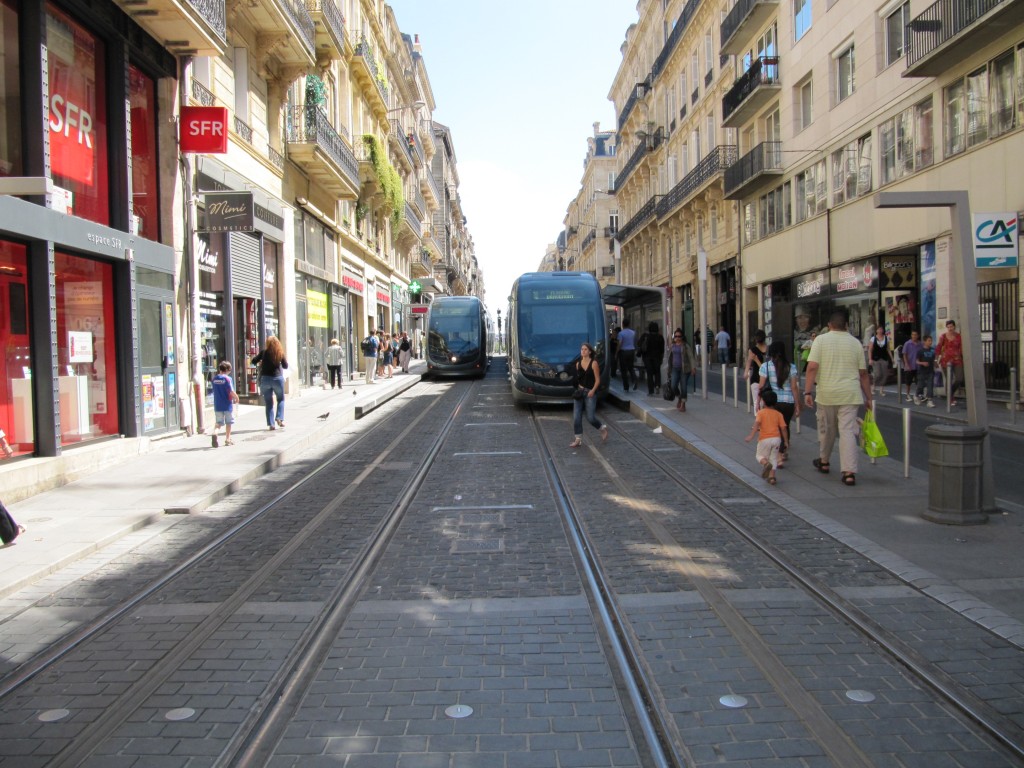
Two wireless trams serve paired center city station platforms

Two wireless trams serve paired center city station platforms

On a visit to Bordeaux in 2010, I drank its fabulous wines, walked along the Garonne, enjoyed its comfortable summer climate… and took note of its innovative trams (light rail/streetcar).  You might be thinking “trams… really?”  Yes!  While most systems are powered by overhead wires, when it opened in 2003 Bordeaux’s system was the only modern example of ground level powered wireless trams in the world.  The proprietary APS system allows for typical overhead wire operation in the areas outside the central city and operation with ground-level power (see photo below) inside it in order to preserve unobstructed views in the old city.  Although the system initially had reliability problems, it now seems to be performing well.

Read more…

Water Savings on Tap at Metro as part of Sustainability Lab

August 21st, 2014 Comments off

New sustainable water treatment systems used to cool underground Metrorail Stations are projected to save Metro millions of gallons of water and hundreds of thousands of dollars annually.

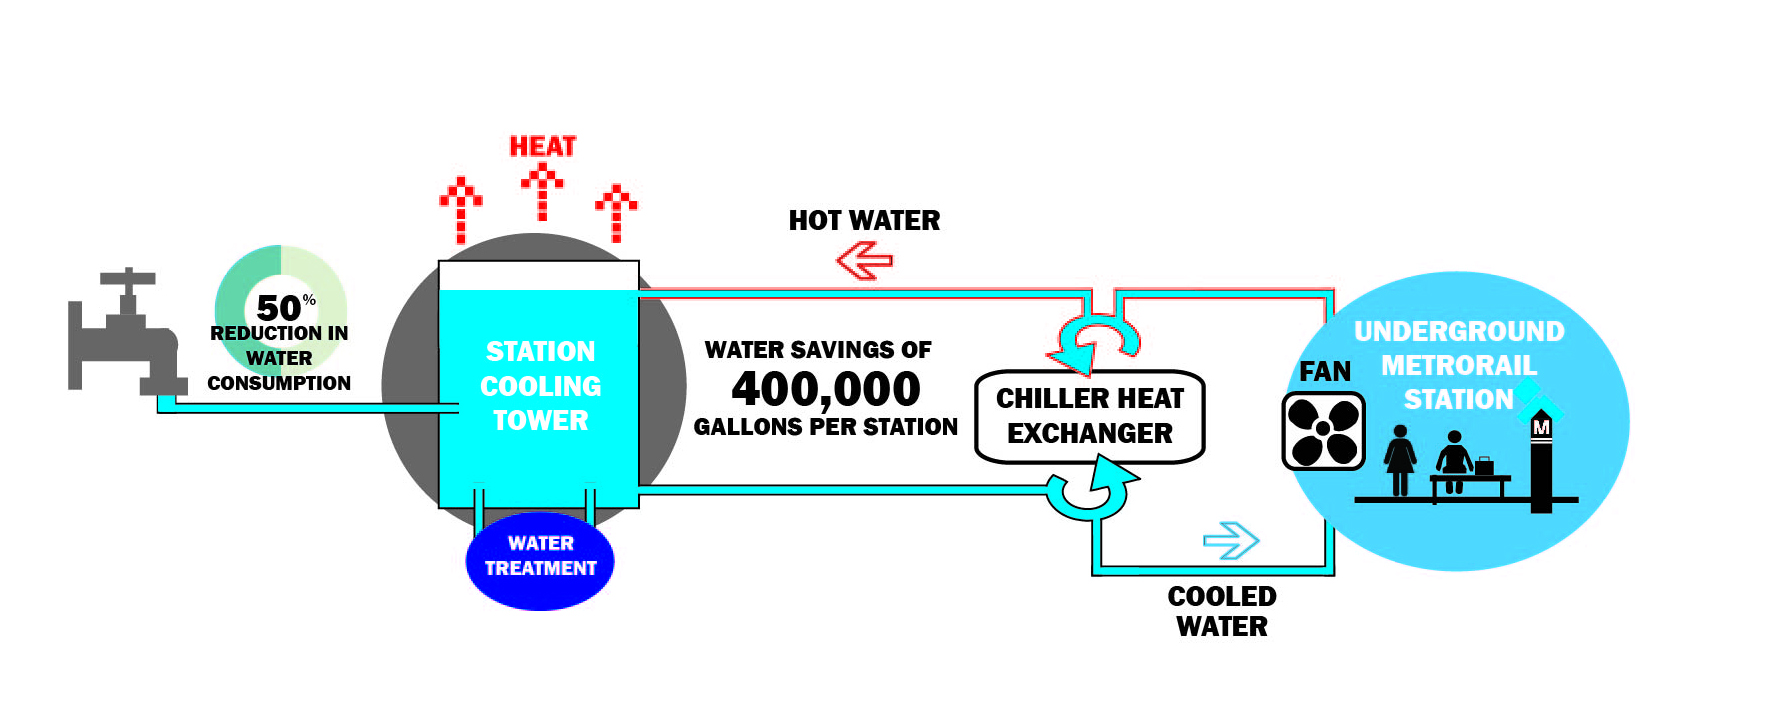
This month, Metro completed one of its first Sustainability Lab pilot projects – the installation of state-of-the-art water treatment systems at seven (7) chiller plants on the Metrorail system. The project will result in an estimated 400,000 gallons of water savings per location annually.

Untitled-1

Metro’s Station Cooling and Water Tower System

Read more…

Silver Line’s Smiling Faces

August 18th, 2014 Comments off

Metro planner captures some smiles of excited Silver Line customers on camera opening weekend.

photo 1

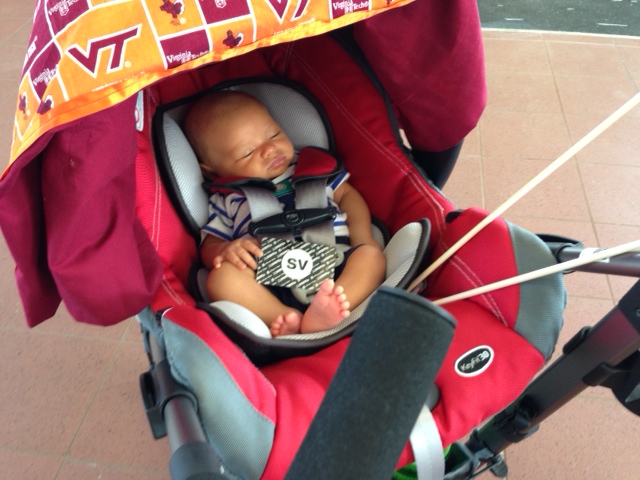
Baby’s first Metrorail trip on SV’s first day.

I offered up my Saturday on a recent weekend to participate in something really cool, the opening of the new Metrorail Silver Line. Metro has a program where employees can help out during special events or scheduled trackwork to guide customers through the fare vending machines or navigate bus bridges. I took advantage of this opportunity because I knew it would be something special.

During my six-hour shift at McLean, I saw a lot of happy people excited to be among the first to ride the new rail line. There were only a few times that I was moved enough to capture the moment on camera. The first is the picture above, a one-month baby with his Silver Line commemorative SmarTrip card, taking his first trip on Metro. Let’s hope it will be the first of many to come. Read more…

Fans Take Metro Home From Soccer Game

August 13th, 2014 12 comments

Over 7,000 customers took Metro home from the soccer game at Fedex Field on Tuesday night, July 29th, and some used the Silver Line!

While researching the ridership patterns of customers using Silver Line and comparing the usage on Monday, July 28th, to Tuesday, July 29th, we started to see an interesting pattern:  a lot more customers were traveling from Morgan Blvd to Wiehle-Reston East.  When we drilled down into the data, we found that these trips were occurring in the evening, well past the end of the PM Peak.  A few web searches later we discovered that a well attended soccer game had been held at FedEx Field on that night.

We then wanted to know, how many and where did they travel?  The chart below compares entries at Morgan Blvd on the 29th and contrasts it against the entries of the previous Tuesday, July 22nd.  It is pretty obvious that except for the soccer game, it was a pretty normal day at Morgan Blvd, good for comparison.  This data tells us that around 7,500 customers took Metro home from the game.  But where did they go?

The chart below shows the stations that our Morgan Blvd customers used to exit the system after the game.  There are a lot of unreadable data points on there, true, but a few really stand out, as annotated.  Most of the big spikes are end-of-line stations, including our newest, Wiehle-Reston East.  This graph also tells us that customers traveling to Wiehle-Reston East made it to their home station faster than those going to Franconia-Springfield.  In total, over 500 customers took the Silver Line home to one of the five new stations after the game.

This chart also raises the question, why were so many soccer fans going to Eastern Market, Metro Center, Foggy Bottom and Pentagon City?  Those are the earlier spikes shown on the graph.   Perhaps those are the neighborhoods where high densities of soccer fans live, or maybe the locations of good sports bars for post-game refreshment.

Did you attend the soccer game and take Metro afterwards?  Where did you go and what was your trip purpose?

 

Major changes coming for Metrobus routes 32 and 36

August 12th, 2014 6 comments

Service improvements are coming along Pennsylvania Avenue and Wisconsin Avenue affecting Routes 32 and 36. These changes are designed to provide more reliable and frequent bus service to the majority of riders.

What are the changes?
Route 32 will no longer provide crosstown service between Southern Avenue and Friendship Heights. Buses will now operate between Southern Avenue and Foggy Bottom. Crosstown service to Friendship Heights will be replaced by the NEW Route 30S. Route 36 will no longer provide crosstown service between Naylor Road and Friendship Heights. Buses will now operate between Naylor Road and Foggy Bottom. Crosstown service to Friendship Heights will be replaced by the NEW Route 30N. NEW Route 33 will operate between Friendship Heights and Archives, replacing routes 32 and 36 service on Wisconsin Avenue. Read more…

Transit Walk Sheds and Ridership

August 11th, 2014 11 comments

Metro cares about transit walk sheds because more households accessible to transit by walking translates directly into more ridership.

We’ve been focusing a lot on transit walk sheds lately. We’ve shown that the size of a transit walk shed depends heavily on the roadway network and pedestrian infrastructure, and that these sizes vary dramatically by Metrorail station. We’ve also demonstrated that expanding the walkable area can make hundreds of households walkable to transit.

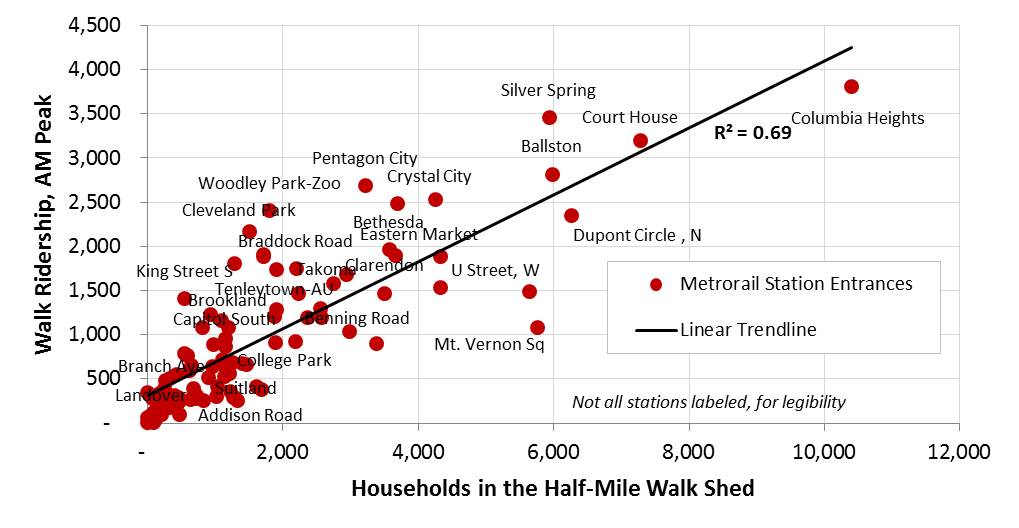
But why do we care so much about walk sheds? Because larger walk sheds mean more households in the walk shed, and that means ridership. For example, we’d be hard pressed to find many households in Landover’s small walk shed, so it’s no surprise that walk ridership at that station is low. On the other hand, thousands of households are within a reasonable walk to Takoma’s larger walk shed, and walk ridership there is much higher.

In other words, the more people can walk to transit, the more people do walk to transit – and data across Metrorail stations prove it:

Correlation between Households in the half-mile walk shed, and AM Peak ridership, by WMATA Metrorail station entrance

More households in the walkable area around a Metrorail station means higher ridership

Read more…

Setting the Targets – Metro’s Sustainability Initiative

August 6th, 2014 2 comments

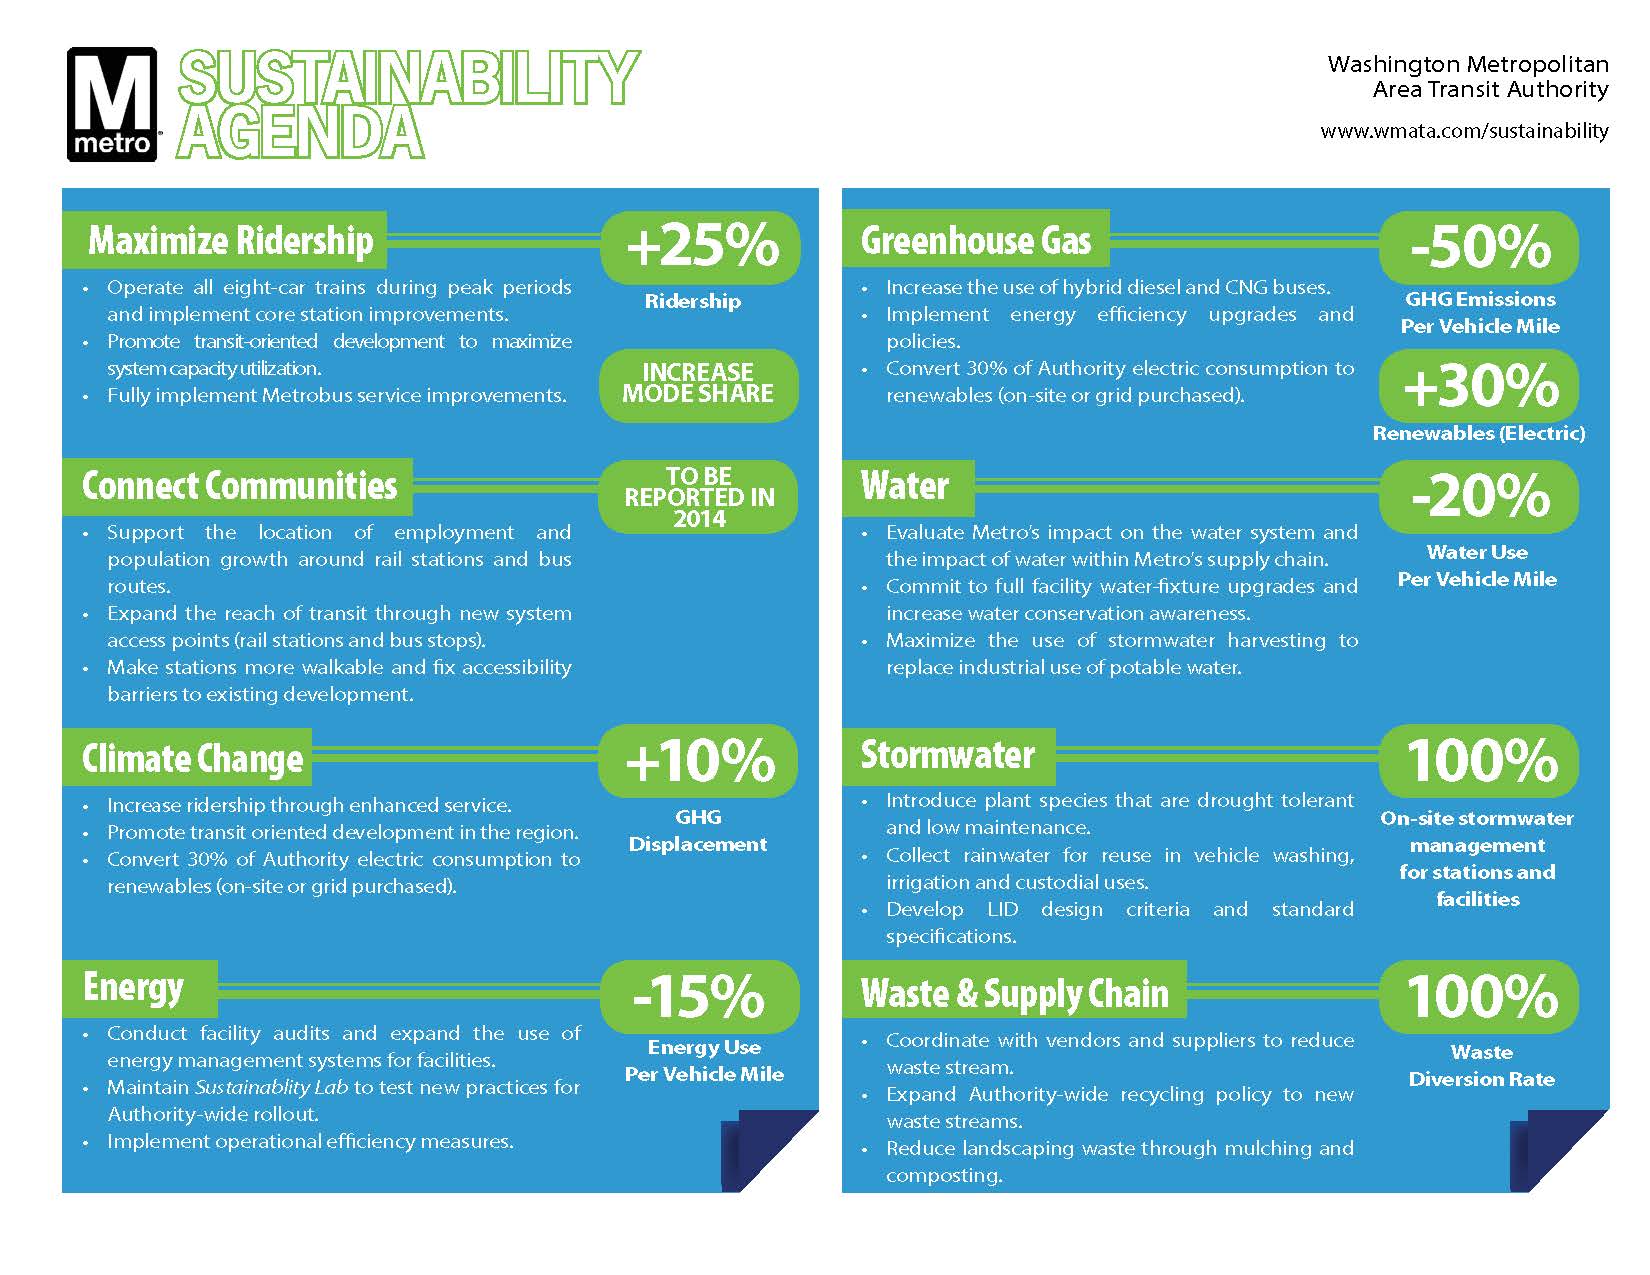
Metro’s sustainability targets both support the region’s sustainable growth and green the Authority’s operations.

Metro's Sustainability Targets

Metro’s Sustainability Targets

The DC metropolitan region is predicted to continue to experience rapid growth through 2025. Over this period, Metro is seeking to expand capacity through Metro 2025 investments as part of Metro’s Strategic Plan Momentum.  As a companion to Momentum, Metro’s Sustainability Initiative is both a commitment to “greening” operations inside and out and a plan to implement and mainstream that commitment. To coincide with this year’s Earth Day, the Authority launched Metro’s Sustainability Initiative, and with it, a set of ambitious but achievable performance targets.

Metro’s sustainability targets position the Authority to both support the region’s sustainable growth and to green the Authority’s operations. To highlight the dual role of Metro’s sustainability program, both regional and Authority focused performance targets have been set, as described below:

Regional Performance Targets:

  • Increase ridership 25 percent by 2025 and increase transit’s “mode share” or the portion of commute trips;
  • Connect Communities by ensuring that more of the region’s growth is served by transit; and
  • Increase the net greenhouse gas the region avoids through transit use (greenhouse gas displacement) by 10 percent by 2025.

Internal Performance Targets:

  • Reduce energy use per vehicle mile 15 percent by 2025, and cut in half greenhouse gas emissions per vehicle mile during the same period;
  • Reduce potable water use per vehicle mile 20 percent by 2025;
  • Source 30% of the electricity Metro uses from renewables by 2025;
  • Achieve 100% on-site stormwater management for stations and facilities (no target date); and
  • Achieve a 100% waste diversion rate/zero waste (no target date).

These performance targets allow Metro to track and manage its support of the regions sustainability goals and the Authority’s resource consumption – a measure of operational efficiency (per vehicle mile) – as well as enabling Metro to report annually on progress towards those aims.

This post forms part of a series featuring content from Metro’s Sustainability Agenda, part of Metro’s Sustainability Initiative.

A Half-Mile Walk to the Nearest Metrorail Station, Mapped

August 4th, 2014 21 comments

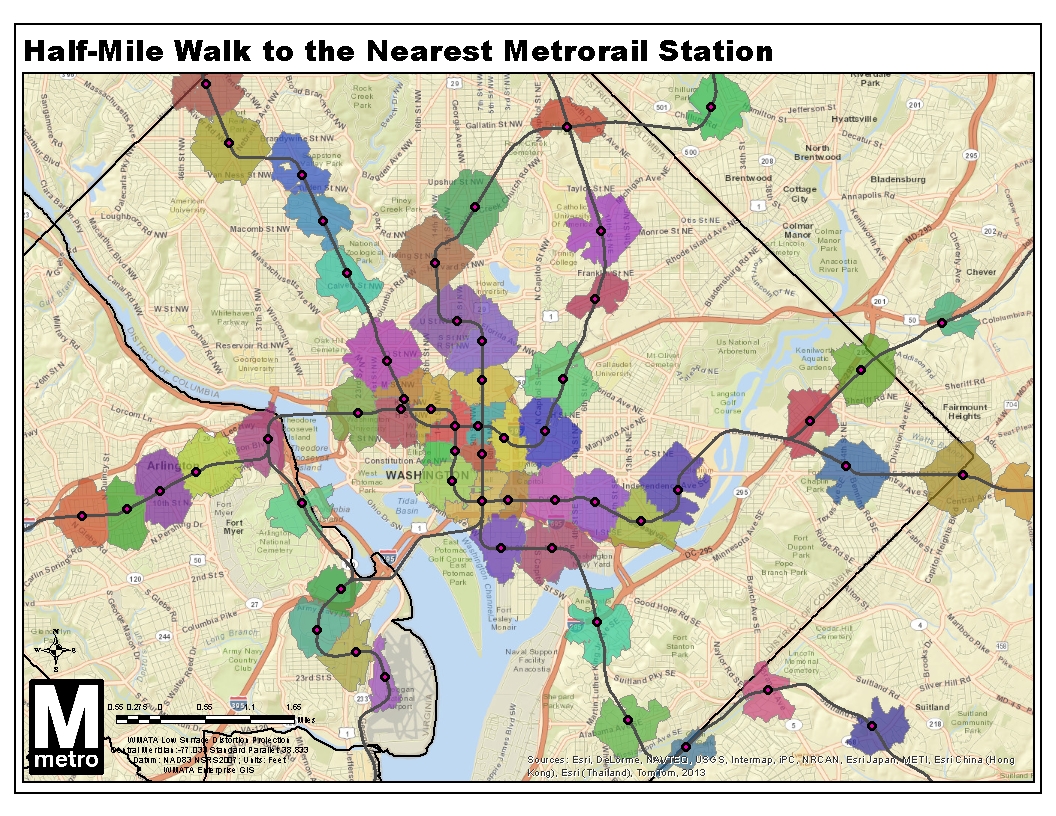
Here’s a map showing the walkable area around the nearest Metrorail station.

eGISBaseLTR_RailPedSheds NonOverlap

Did you ever wonder which Metrorail station is closest? Where’s the breakeven point between two stations? This map shows the areas you can actually reach within a half-mile walk along the roadway network, as we described previously. The twist this time is that I disallowed “overlap” within the GIS network analysis, so land is allotted to the closest station only, calculated by network walk distance.

What do you see in this map?  Here’s a regional view with all stations, as well.

Update 9/2/2014: the GIS source file for this map is now available for download, in geodatabase (.gdb) format.