During the National Cherry Blossom Festival, Metrorail ridership increases on average by 7% on weekdays and 50% on Saturdays.
Metrorail ridership is impacted by a variety of factors, from special events to weather to government shutdowns. One event that brings visitors to the region — and to Metrorail — in droves is the annual National Cherry Blossom Festival. In anticipation of this year’s festival, we performed some analysis on how, when and where the blossom viewers impacted ridership on the Metrorail system.
In general, Metrorail ridership increases on average by 7% on weekdays and up to 53% on Saturdays during the festival. On days with nice weather, ridership has increased up to 10% on weekdays and 70% on Saturdays!
As the figure below shows, during the weekdays there is no impact in the morning, a large (21%) increase of activity during the mid day and then a 7% increase thereafter.
Saturdays are another story all together. Ridership increases up to 63% during mid day and afternoon periods on days during the festival, with a total ridership increase above 50%. Even morning and “late” night ridership increases significantly during this period.
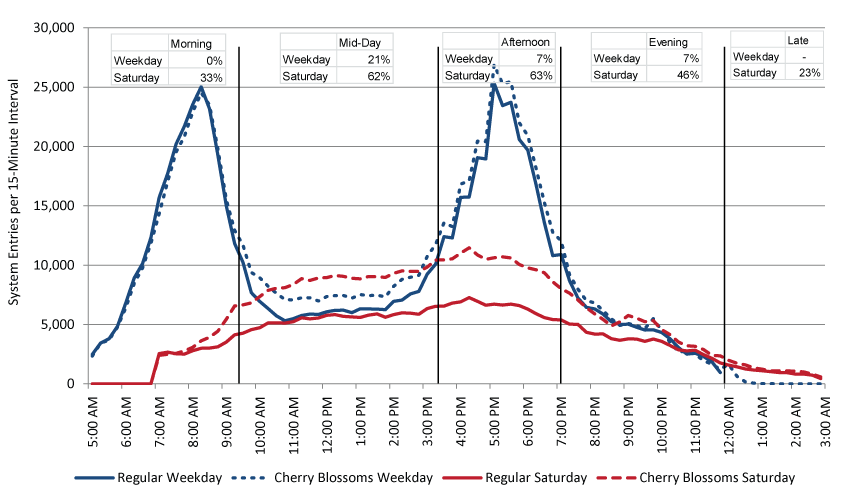
Metrorail system entries by quarter-hour interval, Regular Weekday, Cherry Blossom Weekday, Regular Saturday and Cherry Blossom Saturday. Click chart for larger version.
When looking at change in ridership by station in the maps below, some obvious conclusions can be drawn. Read more…
February 24th, 2014
Shyam
Counting on the Feds alone to fund Metro ignores a long tradition of local jurisdiction funding support – and a ticking clock.

Image borrowed from eRationalmarketing.com. Click for original.
As the region grapples with mounting infrastructure needs (DC, MD and VA) regional leaders are experiencing a bit of sticker shock. That’s because this region has been enjoying the benefits of massive infrastructure capacity increases in transportation, water/sewer, and power that were built in the 1970s and were designed to keep up with growth for half a century.
Those fifty years have almost run out, as has our ability to grow into the capacity built by the previous generation of leaders. And if this region is going to continue its growth trajectory into the middle of this century, we’re going to need to invest in the supporting infrastructure capacities – including funding transit capacity increases via Metro 2025.
Some have argued that funding Metro improvements is primarily responsibility of the Federal government, or at least that the Federal government should lead this effort. That line of argument syncs up neither with the past, present or future – in reality, local jurisdictions have always played a significant role in funding Metro. Let’s lay out the facts about role of local jurisdictions in funding Metro.
- Fact: From 1969 to 1999, of the approximately $10.0 billion spent to construct the original 103-mile system, about $3.8 billion came from local jurisdictions, who always played a large role in the infrastructure investment:
- Fact: System enhancements, such as the Largo Extension and NoMA station, were largely paid for with local money. The Largo extension was paid for with 40% local money (DOC), and the NoMA station was funded with a combination of public and private local monies (PDF) that comprised more than 75% of the capital cost.
- Fact: As WMATA’s Capital Improvement Program (CIP) transitioned from a system expansion focus to more infrastructure renewal, the reliance on federal funding declined. Just look at the graphic below.
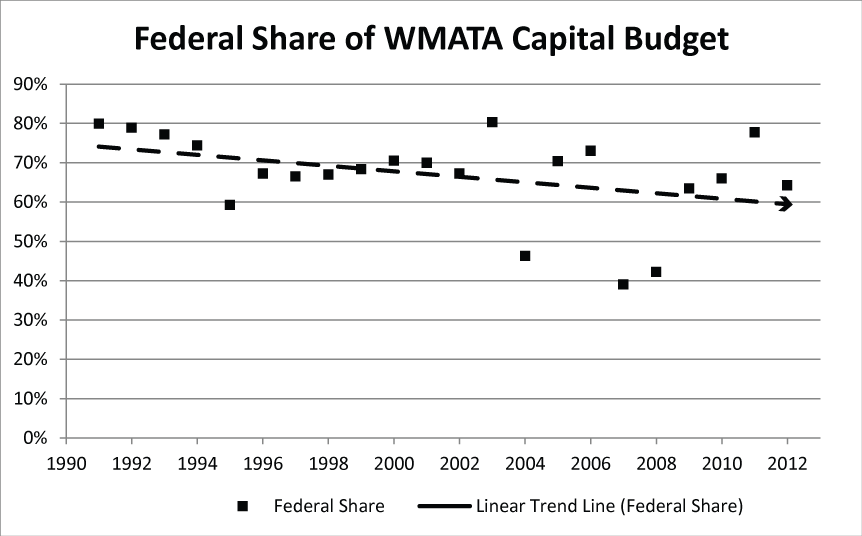
Federal share of WMATA capital budget, 1991 to 2012. Source, NTD.
- Fact: While the 2008 Passenger Rail and Infrastructure Investment Act (PRIIA) authorizes $1.5 billion over ten years to support WMATA’s CIP, Congress was clear in mandating that this funding is contingent upon matching contributions from the region’s governments. In other words, without local jurisdiction funding commitments, monies from the Federal government would not materialize.
- Fact: Among the
two three that does not have a dedicated regional funding source. This despite being the second busiest subway and sixth busiest bus operator in the entire nation.
Those that monitor the Federal government know well that funding sources for major capital projects are in decline, and there are no guarantees to the legislative process. Just take a look at this graphic, from the U.S. Department of Transportation’s Highway Trust Fund Ticker. Read more…
When it comes to impacting weekday Metro ridership, meteorologists are three times more powerful than the federal government.
Many factors influence Metrorail ridership, including the weather and the status of the federal government. As this assessment shows, extreme weather has a much bigger impact on Metrorail usage than the federal government closure for budget reasons.
In the past few months, the federal workforce was instructed to stay home for two different reasons. The first was the failed budget negotiation that resulted in the federal government shutdown in October of 2013. (We’ll call this “shutdown closure.”) The second was the winter weather forecast that closed federal offices in the Washington region. (Let’s call this “snow closure.”) These two separate government closures have had different impacts on Metrorail ridership.
First, take ridership by time of day. The graph below shows ridership by fifteen-minute interval for three days. The tallest, green line is the average of weekday entries. The other two are days that the federal government was closed due to the shutdown (Oct 8, 2013) and snow (Dec 10, 2013). Now, the purple line illustrates the ridership due to the budgetary shutdown in October 2013 and the blue line shows ridership on a federal snow day in December 2013. The purple line (budget shutdown) is not dissimilar to the green (average), but the purple line (snow shutdown) illustrates a huge ridership drop. Why would this be?
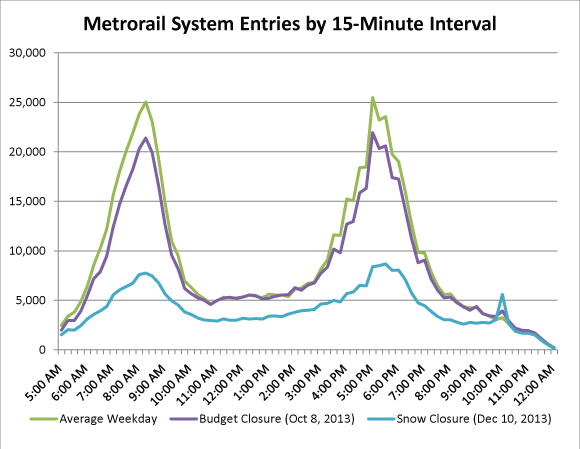
Metrorail ridership on an average day and two days the federal government was shut down. October 8, 2013 was part of the budget shutdown. December 10 2013 the fed was closed due to snow.
We can think of a few reasons for this difference.
- The budget shutdown only impacted SOME federal workers, i.e. those not deemed essential. Snow, however, impacts just about everyone.
- On snow days, area schools are often closed. Parents who have the luxury to do so sometimes stay home to look after their children who would otherwise be in school. Critically, parents who may be limited in child care options – many of whom are our customers – are especially vulnerable and often are forced to stay home because of the school closures.
- Washington is gradually evolving from a federal “company town” into a “boom town of the new economy,” a new economy less reliant on the federal government. Many of the businesses of the “new economy” were unaffected by the budget shutdown, but during extreme weather events take their cue from the federal government and give their employees the day off. According to Dr. Stephen Fuller of GMU’s Center for Regional Analysis, the Washington region is and will be “increasingly less dependent on federal spending as the driver of job growth and income generation in the local economy.”
Next, let’s look at change in ridership by station. Below are maps showing the change in ridership between a regular day and one of the government shutdown days: first budget shutdown and then snow shutdown. Read more…
The Transportation Planning Board (TPB) estimates that without funding commitments from Congress, the District of Columbia, Maryland, and Virginia for Metro’s ongoing maintenance and core capacity improvements, as many as 32,000 future daily transit riders would be pushed onto the roadways instead.
In a recent report, the TPB cites that under the current funding trajectory, Metrorail riders will face significant crowding and experience less service reliability in the future. Critics often cite low forecasts of future Metrorail ridership from the TPB as a reason to avoid committing robust levels of funding for transit. What they don’t tell you is that the ridership numbers emerging from the travel demand model are manually “capped” so that there is no ridership growth beyond 2020 – the year beyond which current levels of maintenance funding levels expires. In other words, because regional leaders have not committed to funding transit, those that forecast travel demand have decided to stop forecasting increases in transit usage. Were it not for this artificial “cap”, travel demand forecasts would show much higher numbers of future transit use. We all know that such a “cap” ignores the last 10-15 years of increasing transit usage region-wide (performance analysis of the CLRP  )
)
Metro’s strategic plan, known as Momentum, proposes a number of core capacity improvements to handle more riders, and offers a plan of initiatives necessary to remove the so-called “transit constraint” placed on the system in 2000. Metro 2025, one of the main components of Momentum, includes:
Read more…
About a third of Metrorail customers transfer between lines to complete their trip, and this is not too far off many of our peer transit agencies.
Everyone would prefer a “one-seat ride” (aka “transfer-free ride”) from origin to destination, but for many, transfers are a necessary part of commuting life. In fact, transfers may be even beneficial. Transfers are a part of nearly every large rail transit system with multiple lines, including Metro. As the chart below shows, 35% of Metrorail passengers change trains at some point during their journey, and that’s slightly higher – but not wildly different from – many of our peer transit systems in the U.S.
Read more…
Without Metro 2025, the region might give up more jobs than the current size of 80 of the nation’s 100 largest downtowns.
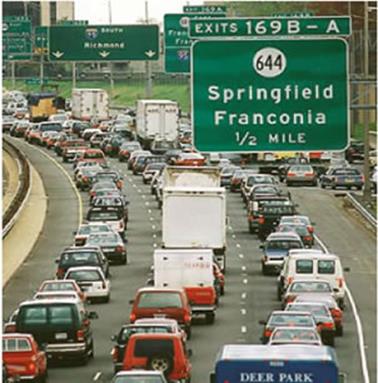
One way to alleviate congestion – limit transit funding and stymie job growth!
The Washington, D.C. region earned in 2012 the unfortunate honor of being named the #1 region in the nation – for congestion. For the workers in this region this comes as no surprise, as seemingly endless “volume delays” litter our evening traffic reports, commuters spend more than a full week and a half sitting in traffic each year, and even the public transit network – primarily Metrorail – is so crowded that commuters often have to wait for multiple trains just to squeeze onto the system. And unless proposed transportation investments keep up with projected household and job growth – MWCOG projects that the region will add 1.6 million jobs by 2040 – these commutes are only going to become more painful.
We all know that the high price of congestion is in the billions of dollars per year, a figure that would be even higher but not for transit’s impact has in reducing the region’s congestion by 10 to 15 percent, saving commuters time and money stuck in traffic, and preventing the need to build hundreds of thousands of new parking spaces and 1,000 additional lane miles of roads.
But that price pales in comparison to what may be if we don’t act now to make meaningful improvements to the regions congestion-reducing transportation infrastructure, especially in programs like Metro 2025. Turns out that we now know that when regions exceed 35 to 37 hours of delay per commuter per year – about four and a half minutes per one way free flow trip – regional job growth begins to slow. That means that expectations of continued economic growth in the region are a lot less rosy when we consider that we currently run about 72 hours of delay per commuter per year – and rising. And before you dismiss this as planning theory, remember that Hewlett Packard showed Atlanta and the nation in 1998 that congestion’s negative impact on employment growth can be economic fact. Read more…


Recent Comments